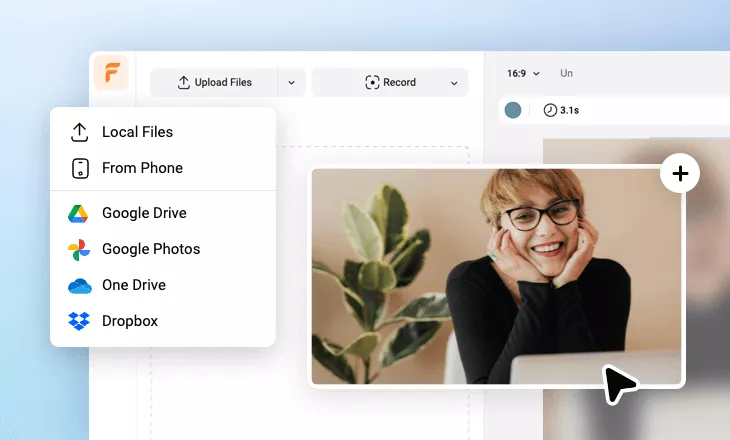
banner

線上免費製作數據統計影片

用影片來展示數據會更加直觀有效。試試用FlexClip做個影片,向別人展示你的統計成果吧!這裏有數百萬影片和圖片素材供你使用。強大的編輯工具讓你能輕鬆做出滿意的效果,即使是新手也能快速掌握。快來試試吧!

免費製作影片
  • 簡單的影片編輯器icon簡單的影片編輯器
  • 種類繁多的範本icon種類繁多的範本
  • 海量媒體庫資源icon海量媒體庫資源
  • 動態文本icon動態文本
  • Trusted by:
  • microsoft-logo
  • google-logo
  • dropbox-logo
  • youtube-logo
  • unsplash-logo
  • storyblocks-logo

專業的數據統計影片範本

  • 現代公司報告樣本
    編輯
    AI剪同款

    現代公司報告樣本

  • 研究報告介紹
    編輯
    AI剪同款

    研究報告介紹

  • 業務報告
    編輯
    AI剪同款

    業務報告

  • 專業年度公司報告業務視頻
    編輯
    AI剪同款

    專業年度公司報告業務視頻

  • 業務簡單項目報告
    編輯
    AI剪同款

    業務簡單項目報告

  • 一季報
    編輯
    AI剪同款

    一季報

  • 世界盃足球賽比賽團隊PK YouTube簡介
    編輯
    AI剪同款

    世界盃足球賽比賽團隊PK YouTube簡介

  • 技術風格大數據影響清單
    編輯
    AI剪同款

    技術風格大數據影響清單

  • 公司-公司-業務年度報告
    編輯
    AI剪同款

    公司-公司-業務年度報告

  • 藍橙 3d 業務報告
    編輯
    AI剪同款

    藍橙 3d 業務報告

  • 業務季度報告演示
    編輯
    AI剪同款

    業務季度報告演示

  • 銷售報告
    編輯
    AI剪同款

    銷售報告

免費編輯、下載數據統計影片

Financial Data Comparison And Analysis Research
Economic inflation rise in interest rates financial graph percentage statistics
Close up of business woman holding clipboard with graphics and financial statistics working overtime in front of computer sitting in start-up business office. Busy employee using modern technology
3D animation of growing histogram. Hi tech charts with grid. Digital display with stock market charts. Camera movement with depth of field
Big data statistic patterns and trends cloud computing analysis graphs and chart
Neon Purple Grid Pattern with Dynamic Circular Data Visualization and Futuristic Interface Design
Chart with upward-pointing bars indicating sequential growth
Statistical graph with business finance concept, 3d rendering.
business, corporate and people concept - businessman and businesswomen with charts at office meeting
Portrait of African American brokerage company specialist wearing headset holding papers walking back and forth in office discussing stock trading issues on phone late in evening
Visual representation of data as a bar chart stamped onto paper
Quantum Volume Benchmark Panel With Wireframe Cube And Score
Business concept where likable confident positive professional international team of specialists consulting about economic indicators depikted on tv screen in evening office
Financial dashboard showing Shorts market data
Female chief analyst holding meeting with four businesswmen showing digital interactive whiteboard with charts, data and statistics at briefing table in office
Data Flow Following Arrow Showing Global Financial Business Network Charts
Graphs and Charts
Business graphs and charts
Graph chart diagram
Seamless pattern background with dollar signs. animation. small, black dollar signs slowly blink on grid. Perfect to use in presentation. Can put your text, charts, graphs in it.
Graph chart diagram
Professional is engaged in planning working with charts and graphs
statistics infographic bars data animation
Mentioning demographic shift in media headlines

為什麼要做數據統計影片範本

  • Promo Video

    促進銷售

    一個引人注目的影片能更大程度地影響購買行為、促進銷售。

  • Promo Video

    增加流量

    在推動網站流量方面,沒有什麼能與影片內容相比。

  • Promo Video

    鼓勵社交分享

    社交媒體平臺上的影片獲得的贊和分享比圖片和文字加起來還要多。

數據統計影片製作三步曲

  1. 1

    添加媒體檔

    從電腦中上傳影片、圖片,或者從資源庫中添加素材到故事版。

  2. 2

    編輯

    添加文本、音樂、畫外音等來編輯你的數據統計影片。

  3. 3

    輸出

    選擇合適的比例和清晰度下載數據統計影片,然後分享給其他人。

數據統計影片製作三步曲

相關主題

Editor thumbnail
輕鬆線上製作數據統計影片
免費製作影片